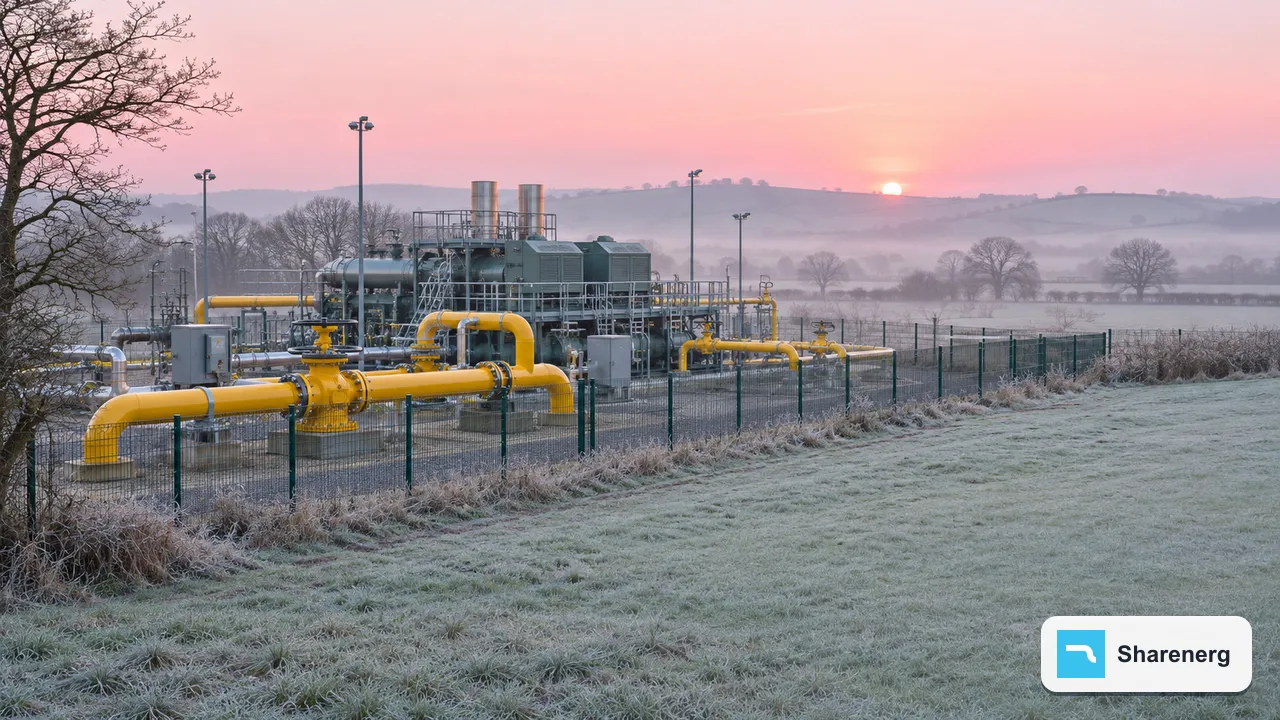
National Gas expects Great Britain to have enough gas supply capability to meet demand throughout winter 2026/27, including under unlikely high-stress scenarios. Its Gas Winter Outlook, published in October 2026, puts the 1-in-20 peak day demand at 493 million cubic metres per day (mcm/d) against a peak supply capability of 592 mcm/d. The margin is wider than last winter, mainly because more liquefied natural gas (LNG) can now enter the National Transmission System.
The headline numbers
The Gas Winter Outlook 2026 compares a severe winter day, the sort of demand Britain should expect only once in twenty years, with the maximum the system can bring in. The key figures, all in mcm/d, are:
| Measure | 2025/26 | 2026/27 |
|---|---|---|
| 1-in-20 peak demand | 482 | 493 |
| Peak supply capability | 565 | 592 |
| Supply margin | 83 | 99 |
| Largest single infrastructure loss (N-1) | 72 | 81 |
| Margin after N-1 loss | 11 | 18 |
The N-1 test removes the single largest piece of NTS infrastructure on the same day as peak demand. National Gas stresses that this combines two very unlikely events, but it is the number engineers watch, because it shows how much headroom remains if something big trips on the coldest day.
Where the extra demand comes from
Peak demand is forecast 2% higher than last winter. Most of the rise is gas for power stations, up from 98 to 105 mcm/d on a peak day. National Gas says it has seen gas demand for power generation above 100 mcm in each of the last four winters, and the forecast now reflects that pattern. On a still, cold evening with low wind output, gas-fired plant does a large share of the balancing for the electricity system.
Non-daily metered demand, which is mostly homes and small businesses on the distribution networks, is forecast at 315 mcm/d, up 1%. National Gas attributes the small increase to updated composite weather variables, which are reviewed every five years. It also notes that high prices tend to reduce household demand across a whole winter but have less effect on a single very cold day. Exports to Ireland on a peak day stay at 39 mcm/d.
This links with the electricity side. NESO's Winter Outlook press release of 23 October 2026 forecasts a 5.9 GW electricity margin, about 9.5% above peak demand, and names gas-fired power alongside batteries and wind as a source of flexibility. The two outlooks are meant to be read together.
Where the supply comes from
National Gas breaks peak supply capability down by source for 2026/27:
- Norway: 134 mcm/d, slightly down, reflecting declining flows through the FLAGS system into St Fergus.
- UK Continental Shelf: 86 mcm/d. Last winter's actual peak was 91 mcm/d, above what had been forecast.
- LNG: 174 mcm/d, up 16%. Both South Hook and the Isle of Grain completed expansion projects last winter.
- Imports from continental Europe: 83 mcm/d, made up of 61 mcm/d through Interconnector and 22 mcm/d through BBL.
- GB storage withdrawal: 113 mcm/d.
- Biomethane: 2 mcm/d, included in the assessment for the first time.
UKCS and Norwegian gas provide the baseload, while LNG and storage flex with demand. In a cold winter, Britain is also likely to need imports from the continent.
The Rough caveat
The storage figure excludes Rough, because the site received no injections over the summer. Rough's future is the subject of a dispute between Centrica and government, covered in our article on what losing Rough would mean. National Gas also notes that it has facilitated arrangements to keep import capability through Interconnector Limited, subject to regulatory approval, which Ofgem consulted on from 22 October 2026.
What the network operator can do on a tight day
Margins on paper do not move gas. On the day, National Gas balances the network with a set of tools set out in its System Management Principles Statement. For 2026/27 it has booked 92 mcm of Operating Margins gas, with a maximum deliverability of 49 mcm/d, which can be called on to manage pressure and short-term imbalances.
In a more extreme and prolonged supply loss, a Network Gas Supply Emergency could be declared. The tools listed in the outlook include accepting gas outside normal specification, public appeals to shippers to increase supply, enforcing commercial contracts with large customers to cut demand, and contracts with storage operators to maximise withdrawals. These are rarely used, but the procedures are tested.
Why this matters to pipeline engineers
For engineers working on the NTS and on connected assets, the outlook is more than a supply forecast. A few practical points stand out:
- Linepack swings. Higher and more volatile gas-for-power demand means faster changes in linepack and pressure within the day. Compressor stations and pressure control points see more cycling, which matters for fatigue and maintenance planning.
- LNG terminal flows. With more of the peak coming through South Hook and Grain, flows across the southern and western parts of the network change compared with the historic north-to-south pattern from St Fergus and the east coast terminals.
- Asset condition. The N-1 margin depends on the largest assets staying available. Inspection and maintenance windows, and the integrity data behind them, feed directly into security of supply. Our piece on digital twins and in-line inspection looks at how operators use that data.
- Cold weather operations. Above-ground installations face hydrate and icing risks when wet gas and low temperatures combine, a problem familiar from subsea flow assurance.
Risks the outlook does not rule out
National Gas is confident the market will perform as expected but says events could still put the system under stress. European wholesale prices have been volatile through 2026, and storage stocks across Europe affect how readily continental gas flows to Britain in late winter. NESO has also said it will watch periods where supply and demand are more finely balanced.
For most households and businesses, the conclusion is reassuring: there is enough physical capacity. For operators and engineers, the detail shows where the pressure points are, and why assets like LNG terminals, interconnectors and storage remain central to a winter plan even as the energy system changes.